A Practical Guide to Scanning and Transmission Electron Microscopy Simulations
Transmission Electron Microscopy
TEM Simulations with Parallel Illumination
Initial Conditions of the Electron Wave
After building an atomic potential as described in the Electron Scattering Algorithms, the first step in a TEM simulation is to choose the initial wavefunction for the simulation. The simplest case for the incident beam is to set to unity everywhere in the plane, which means perfectly even illumination across the sample:
However, it is possible to introduce more complications, such as a slightly titled plane wave. The sampling is set by the gridpoint and extent as described in section Simulation Inputs.
Imaging
A TEM image is simulated by propagating the wavefunction through the specimen potential using the multislice algorithm (as described in Electron Scattering Algorithms), which calculates how the wave evolves due to scattering by the specimen atoms and the propagation through it. The resulting exit-wave is complex, but can be visualized via its intensity.
For a more realistic image, a contrast transfer function can be applied to model the optics of the microscope. More details aberrations can be found in Wave Aberrations. In TEM, aberrations () modify the exit wave () after the multislice simulation:
Note that in TEM simulations, aberrations are added after the computationally time-consuming multislice calculation, which described the physics of the interaction.
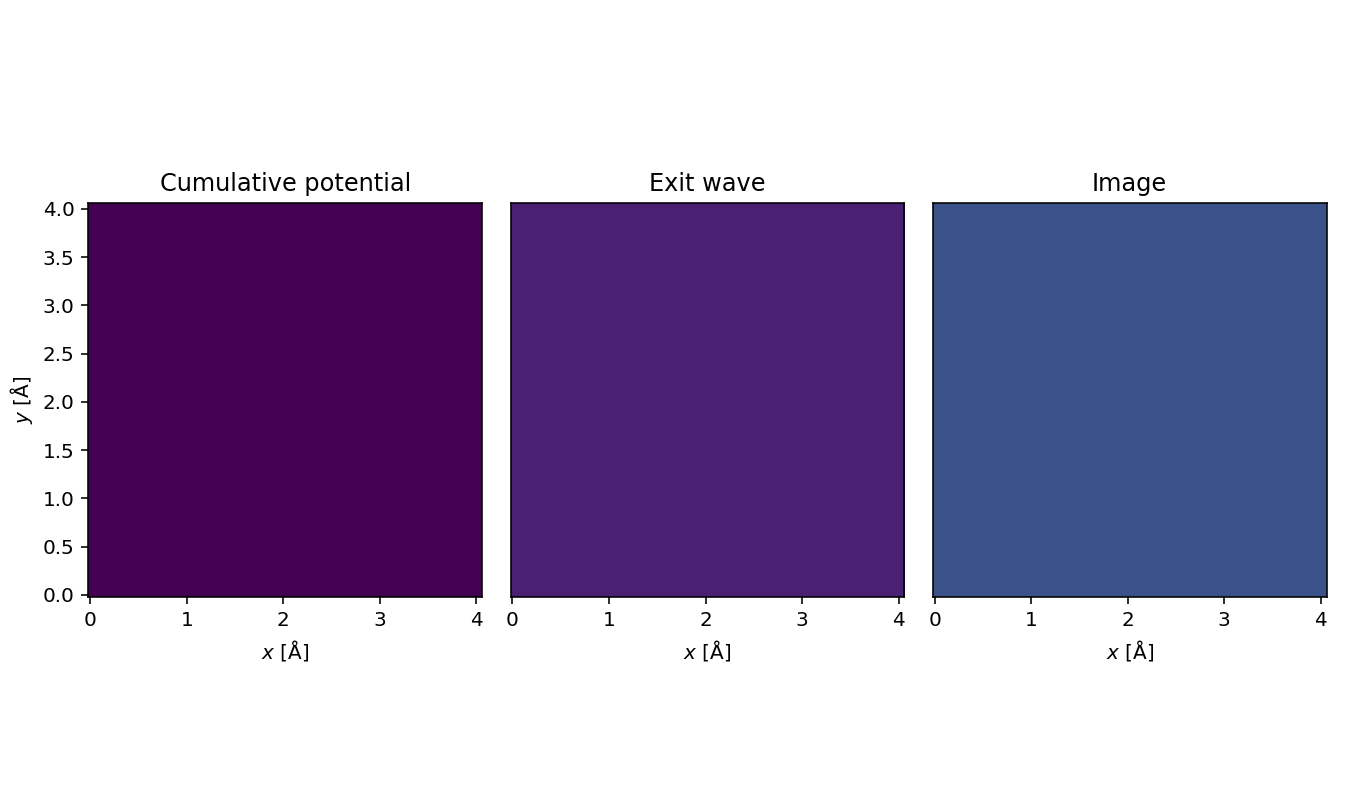
In Figure 1.1 we show an interactive visualization of the cumulative projected potential of gold with a lattice constant of 4.08 Å in the <100> zone axis, the corresponding exit wave function, and the resulting image as a function of depth through the specimen. The multislice algorithm is only accurate in the limit of good (small) sampling rate and thin slices, but improving these parameters also increases computational cost. A sensible value for the sampling is between and , and the slice thickness is typically between and ; we use a value of here.
In Figure 1.1, we start with no potential and correspondingly the exit wave is flat and has no features. As the thickness of the gold sample increases, so does the potential, which is why we see increased contrast in the left panel. The corresponding exit wave calculated from the multislice simulation is shown in the middle. We are visualizing the intenisty of the exit wave (more information about phase in Contrast Transfer and Phase Imaging). The relationship between the exit wave and thickness is not linear as in th case of the potential, so you will see oscillations as the thickness changes.
Finally the right panel shows the resulting image from this simulation. To describe a parallel illumination TEM experiment, we use a plane wavefunction with an energy of . For the CTF, the spherical aberration will be set to (remember that abTEM uses units of ) and the defocus is set to the Scherzer defocus. The aperture is set at the first zero cross-over of the CTF, and a focal spread of is applied as an easy way to model realistic blurring of the image.
Electron Diffraction Patterns
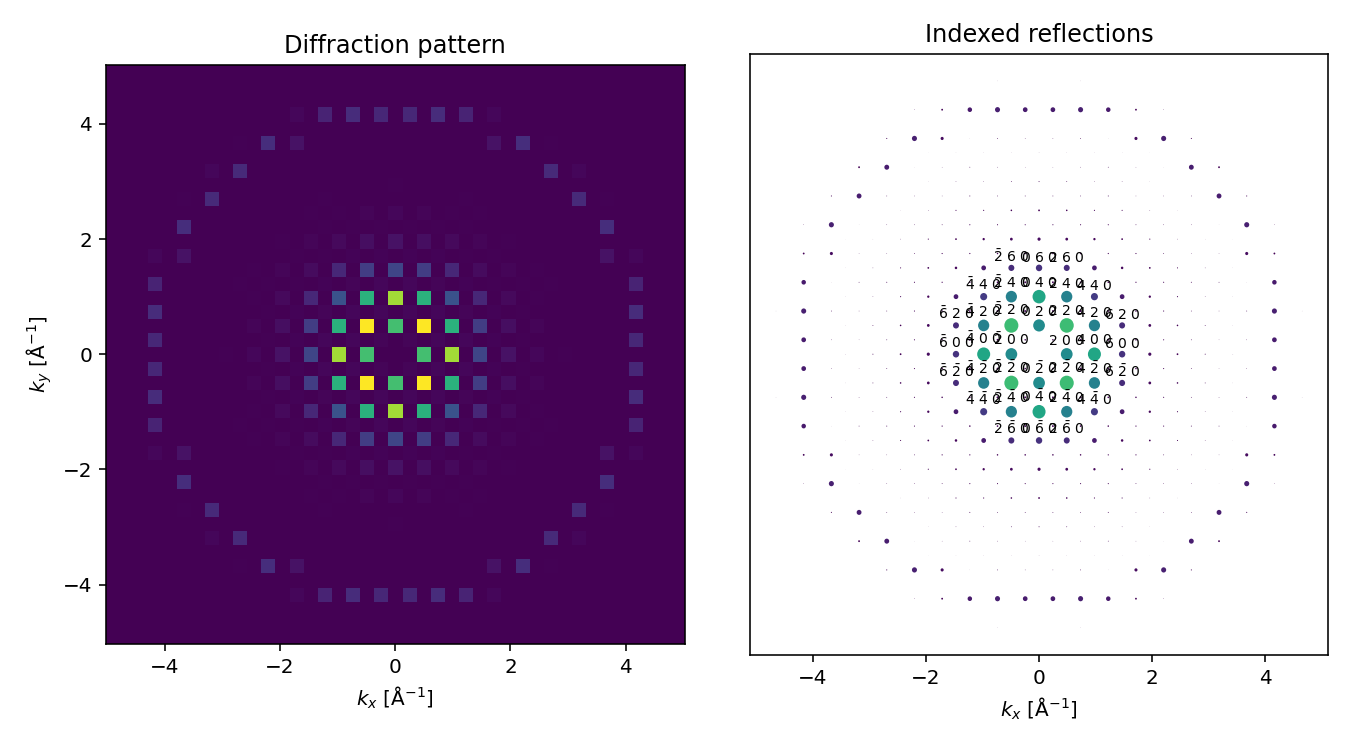
Instead of an image, we can instead simulate a selected area diffraction (SAD) experiment by using the DiffractionPatterns method. We use block_direct=True to block the direct beam, which typically has a much higher intensity than the scattered beams, making it show it on the same scale. In a real experiment, you may similarly use a central beam stop in order to to visualize the scattered beams.
You may wonder; why do the diffraction spots look like squares? This is because the incoming wave function is a periodic and infinite plane wave, hence the intersection with the Ewald sphere is pointlike. However, since we are discretizing the wave function on a square grid (i.e. pixels), the spots can only be as small as single pixels. In real SAD experiments, the spot size is broadened due to the finite extent of the crystal as well instrumental effects.
We can use the index_diffraction_spots method to create a represention of SAD patterns as a mapping of Miller indices to the intensity of the corresponding reflections. The conventional unit cell have to be provided in order to index the pattern, we can provide this as the unit cell of the gold crystal we created earlier, we cannot use the the repeated cell.
In Figure 1.2 we show an interactive visualization of the diffraction intensities and indexed diffraction spots as function of the depth through the specimen. We see that the {100} reflections are extinguished, as is expected from the selection rules of an F-centered crystal. We can also observe that the <220> spots end up with significantly higher intensity than the <200> spots; this is due to dynamical scattering — which is accounted for by the multislice algorithm. Finally you may notice as the thickness increases, the apperance of higher order laue zones.
Contrast Transfer and Phase Imaging
Thus far we have been considering how to form images and diffraction patterns with perfect incident illumination and at infinite dose. However, often we’re interested in simulating TEM experiments under more realistic conditions.
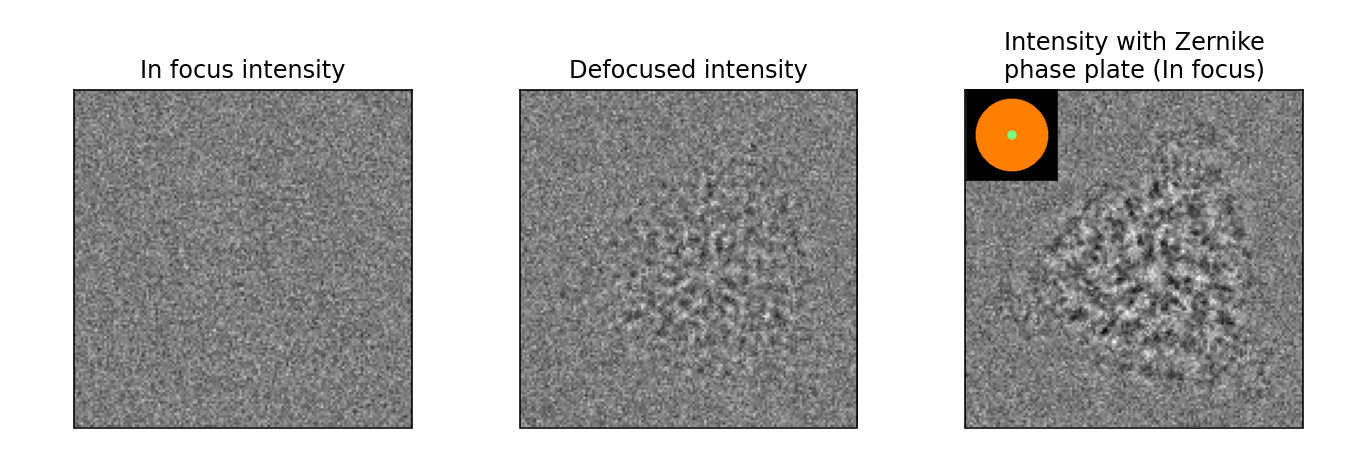
One example of the importance of aberrations and wavfunction modification is shown in Figure 1.3. Although the wavfunction at the imaging plane ()) may be complex, only the intensity of the exit wave is measured by detectors. Weakly scattering samples impart very little ampltidue contrast on the incident beam, so most of the structural information is encoded in the phase of the exit wave. This is especially well known in the case of imaging of biological materials, as these structures are beam-sensitive and composed of low atomic number (weakly scattering elements). This effect is evident in the left pannel of Figure 1.3; as the dose decreases, it is very challenging to observe the simulated covid spike protein.
Note that simulations described thus far are performed to the limit of infinite electron dose. Leaving aside other factors, the main source of noise in S/TEM is so-called shot noise arising from the discrete nature of electrons. We can effectively emulate finite dose by drawing random numbers from a Poisson distribution for every pixel. We apply this so-called Poisson noise corresponding a dose per area, for example in the Figure 1.3.
As discussed in Imaging, we may also be interested in seeing how aberrations or other beam modifications impact imaging conditions. For the same dose, the image contrast can be increased by modfying the wavefunctions by way of aberrations. This is most often done with defocus, which is illustrated in the middle pannel Figure 1.3. The resulting image has improved contrast, making it easier to visualize the covid spike protein. The middle pannel shows the defocused image, and the aberrations can often be corrected for later in post-processing.
The phase of the spike protein can also be image through the introduction of a phase plate after the sample. This simulation (Figure 1.3 right) shows a Zernike phase plate Zernike, 1942, where electrons scattered to higher angles, gain an extra phase shift. This high-contrast image is free of aberrations, making it easy to see the spike protein. However, changing the slides on the widget highlgihts some of the challenges of phase contrast imaging with a phase plate. The best transfer of information occurs with a phase plate that approximtes a delta function, meaning all the electrons exepct those in the very center of the aperature get an extra phase shift. However, as the size of the hole increases or the phase shift changes, the transfer of information gets worse.
- Zernike, F. (1942). Phase contrast, a new method for the microscopic observation of transparent objects. Physica, 9(7), 686–698.
- Walls, A. C., Tortorici, M. A., Bosch, B.-J., Frenz, B., Rottier, P. J., DiMaio, F., Rey, F. A., & Veesler, D. (2016). Cryo-electron microscopy structure of a coronavirus spike glycoprotein trimer. Nature, 531(7592), 114–117.


